How to Detect Bypass Attempts with `chainsaw doctor --bypass-check`
Find clients that are still reaching the public registries directly — the proxy is in place, but did everyone actually point at it? Two complementary surfaces: the doctor command from each client, and the `direct_registry_egress` view from the control plane.
The Bypass Problem
The classic Chainsaw failure mode is not “policies are wrong” or “the proxy is down”. It is silent bypass: the proxy is healthy, the policies are tuned, and one developer / one CI runner / one production node is quietly hitting registry.npmjs.org directly because someone forgot to set npm config registry or the env var was overridden by a script.
Two surfaces detect this:
chainsaw doctor --bypass-check— runs from each client, probes whether the public registries are reachable, and reports the result back to the control plane./api/bypass/clients— the control-plane view of every client and whether the most recent attestation showeddirect_registry_egress: reachableorblocked.
The first is endpoint-side. The second is server-side. You want both.
Prerequisites
- Chainsaw deployed and packages flowing.
- Optionally: the network egress layer applied from tutorial 54. Bypass detection works without it but is much less interesting — without the egress block,
direct_registry_egress: reachableis the expected state.
Step 1: Run the Doctor on a Client
From any host running the CLI:
chainsaw doctor --bypass-check
Output:
checking package manager configuration ...
  npm:    OK (registry → https://chain305.com/chainproxy/repository/@default/npmjs/)
  pip:    OK (index-url → https://chain305.com/chainproxy/repository/@default/pypi/simple/)
  docker: OK (registry → chain305.com)
  maven:  WARN (no managed mirror; project poms must explicitly route)

checking direct registry reachability ...
  registry.npmjs.org:443     reachable   ← BYPASS POSSIBLE
  pypi.org:443               blocked     ← OK
  registry-1.docker.io:443   blocked     ← OK

posting attestation to control plane ...
  posted (attestation_id=abc123)

exit code: 1   (drift detected)
The reachable rows are the ones to act on. They mean a developer / CI runner / pod on this network could sidestep the proxy by manually configuring a different registry, even if right now they aren’t.
The doctor exits non-zero if any registry is reachable, which makes it a clean CI gate — fold it into pipeline preflight (the bundle’s ci/github-actions.yml does this for you).
Step 2: Schedule the Doctor on Every Endpoint
A single ad-hoc run is not the goal. The goal is for every endpoint to attest its posture daily so the control plane has a current view.
The MDM scripts from tutorial 54 already schedule this. If you didn’t use the hardening bundle, schedule it manually:
- Linux: a
systemd.timerrunningchainsaw doctor --bypass-check --attestdaily. - macOS: a
launchdplist with the same command. - Windows: a Scheduled Task with the same command.
- CI runners: include the doctor in your pipeline preflight; every CI run posts an attestation.
- Kubernetes pods: a
CronJobrunning the doctor in a sidecar with shared network namespace, daily.
Step 3: View the Bypass Page
In the dashboard, the bypass triage queue at /insights/coverage/bypass shows the control-plane view. It is linked as Open bypass triage from the Coverage page at /insights/coverage:
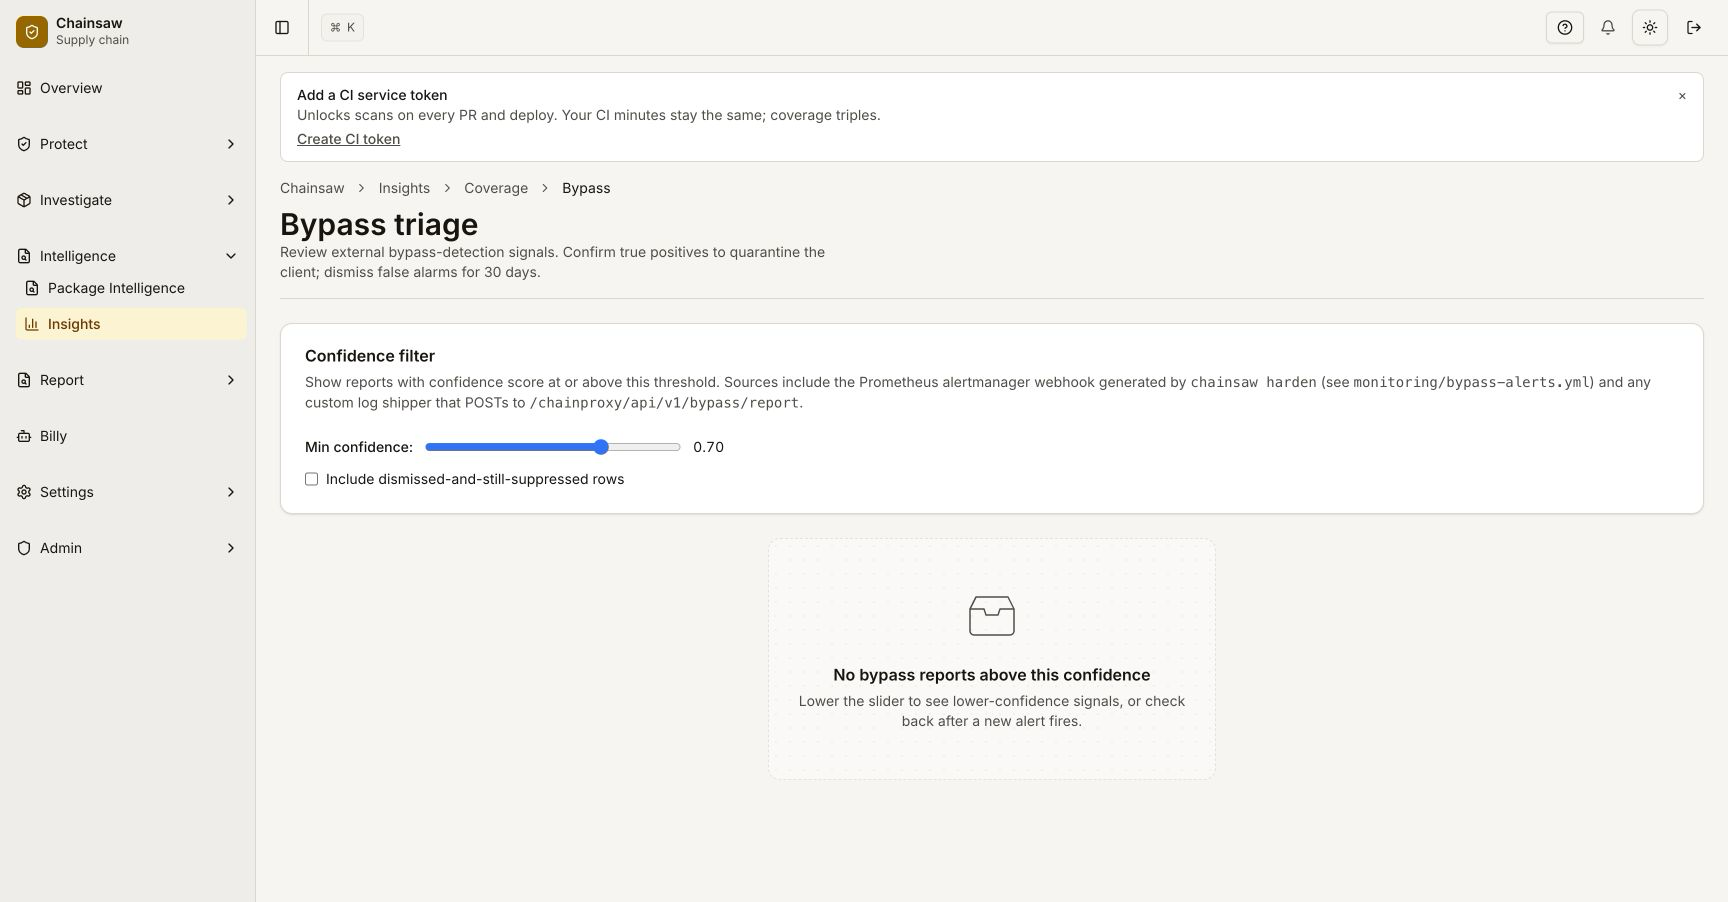
Columns:
| Column | Meaning |
|---|---|
| Client / device | The actor that posted the attestation. For CI runners, the runner ID. For laptops, the MDM device ID. |
| Last attestation | When the doctor last ran. A stale attestation (>48h for endpoints, >24h for CI) is itself a signal — the client may have stopped reporting. |
| direct_registry_egress | reachable (bad), blocked (good), or unknown (no recent attestation). |
| Reachable hosts | The specific upstream registries that responded. |
| Suspect bypass | Whether the client also has recent registry egress activity with no matching audit entry on the proxy — strong signal that they actually used a bypass, not just that they could. |
The Suspect bypass facet is the key column. A client with reachable: true but no suspect-bypass entries is just a misconfigured network — annoying, but not actively exploited. A client with reachable: true and suspect-bypass entries means an actual install happened that did not go through the proxy.
Step 4: Hit the API Directly
curl -H "Authorization: Bearer $CHAINSAW_TOKEN" \
     "https://chain305.com/chainproxy/api/bypass/clients?status=reachable&limit=50" \
     | jq '.clients[] | {client_id, last_attestation, reachable_hosts, suspect_bypass}'
For the suspect-bypass detection in particular:
curl -H "Authorization: Bearer $CHAINSAW_TOKEN" \
     "https://chain305.com/chainproxy/api/bypass/clients?suspect=true&since=24h" \
     | jq '.clients[] | {client_id, suspect_evidence}'
suspect_evidence is an array of detection records — each one is a bypass-shaped event the platform observed (e.g., a Docker image pulled by client X that has no matching audit entry on the proxy for the last 30 days). The suspect record explains why the platform thinks a bypass happened, not just that it might have.
Step 5: Wire the Webhook
When direct_registry_egress flips to reachable after it was previously blocked, Chainsaw fires a chainsaw.bypass.attempted outbound webhook. This is the high-signal alert — it means a network layer drift is in progress.
Configure destinations at Settings → Webhooks (see tutorial 59). Recommended:
- Slack channel for the on-call security team.
- PagerDuty service if your environment treats this as paging-worthy.
- Append to your SIEM event stream (also see tutorial 58).
The payload is HMAC-signed. Verify the signature before acting.
Step 6: Diagnose a Reachable Client
When a client surfaces with reachable_hosts: [registry.npmjs.org], the diagnostic steps are:
- Is the egress layer actually applied at the network the client is on? A laptop on the office VPN should be fully covered; a laptop on the home wifi might not be. Check whether the client’s IP is inside the SWG perimeter.
- Is the host’s DNS pointing at the SWG resolver? A client that does its own DNS bypasses the SWG entirely. Confirm with
dig +short registry.npmjs.orgon the client; it should resolve to a Chainsaw-mediated address or a dead address (not the realregistry.npmjs.orgIP). - Was the egress layer recently changed? Regenerate a fresh bundle from the /admin/hardening wizard to confirm the allowlist hasn’t drifted, and confirm the new allowlist was actually pushed to the SWG.
The Bypass page links each row to a “Diagnose” panel that walks these checks for the affected client.
Step 7: Set the Right Alert Threshold
Not every transient reachable is paging-worthy:
- A laptop coming online over a coffee-shop wifi will flip
reachableuntil it joins the corporate VPN. This is normal and self-healing. - A CI runner whose pipeline preflight fails should already have failed the build — the bypass alert is redundant.
The high-signal alert is CI runners with suspect_bypass: true and production hosts (k8s nodes, build agents) with reachable: true lasting more than the configured grace period (default 1 hour). Tune the alert rule:
# Slack / PagerDuty filter rule
trigger:
  on: chainsaw.bypass.attempted
  where:
    actor_kind in [service-token, k8s-node]
    duration > 1h
    suspect_bypass == true
Verification
- From a host configured to use Chainsaw,
chainsaw doctor --bypass-checkreportspip: OK,npm: OK, etc. - Open
/insights/coverage/bypass— at least one row appears (your test host). - Temporarily allow direct egress from the test host (e.g. by being off-VPN). Re-run the doctor —
reachableflips to true. The dashboard reflects this within a minute. The webhook fires. - Restore the egress block. Re-run the doctor — back to
blocked.
Related Topics
- How to Generate a Hardening Bundle — the layers
doctor --bypass-checkis verifying. - How to Enforce Chainsaw Org-Wide — the conceptual frame.
- How to Send Outbound Webhooks — wire
chainsaw.bypass.attemptedto your alerting stack.