How to Monitor and Analyze Traffic Patterns
Use the Traffic page to track package requests, filter by repository/client/outcome, identify anomalies, and understand your organization's dependency patterns.
Overview
The Traffic page is Chainsaw’s real-time activity log. Every package request that flows through the proxy is recorded with full context — package name, version, client, repository, outcome, and timestamp. This tutorial covers how to use the Traffic page to monitor activity, detect anomalies, and understand your organization’s dependency consumption patterns.
Prerequisites
- Any role in Chainsaw (Member or above)
- Traffic flowing through the proxy
Step 1: Navigate to the Traffic Page
Click Traffic in the sidebar. You’ll see a reverse-chronological feed of all package requests.
Step 2: Understand Traffic Entries
Each traffic entry contains:
| Field | Description |
|---|---|
| Timestamp | When the request occurred |
| Repository | Which registry was targeted (npmjs, pypi, etc.) |
| Package | Package name |
| Version | Requested version |
| Client ID | Which credential made the request |
| Client Type | End User, Service Token, or AI Agent |
| Outcome | Success, blocked, flagged, or failed |
| Cache | Hit (served from cache) or miss (fetched upstream) |
Step 3: Filter Traffic
By Repository
Focus on a specific ecosystem:
By Client
Track a specific team or pipeline:
By Outcome
Focus on blocked or flagged requests:
By Date Range
Set a time window for your analysis:
Step 4: Detect Anomalies
Watch for these patterns in the traffic feed:
Unusual Volume Spikes
A sudden increase in requests may indicate:
- A new CI/CD pipeline being configured
- A dependency update pulling many new packages
- An automated attack (dependency confusion, mass scanning)
Unexpected Packages
Packages you don’t recognize in your ecosystem:
- New transitive dependencies pulled in by an update
- Typosquatted packages (similar to known packages)
- Packages from unexpected ecosystems
Failed Requests
A cluster of failures may indicate:
- Upstream registry outage
- Misconfigured client credentials
- Network connectivity issues
- Package name typos in build configurations
Unusual Client Activity
A client credential that suddenly starts requesting packages from a new ecosystem or at unusual times.
Step 5: Analyze Dependency Patterns
Use traffic data to understand your organization’s dependency landscape:
Most Requested Packages
Identify your most critical dependencies — these deserve extra scrutiny:
Ecosystem Distribution
Understand which package managers dominate your traffic:
Client Activity Comparison
Compare traffic volumes across teams and pipelines:
Step 6: Investigate Blocked Requests
When a request is blocked, click on it to see:
- Which policy triggered the block
- Why — the specific condition that matched (CVSS score, license, etc.)
- Package details — version, ecosystem, metadata
- Client context — who requested it and from where
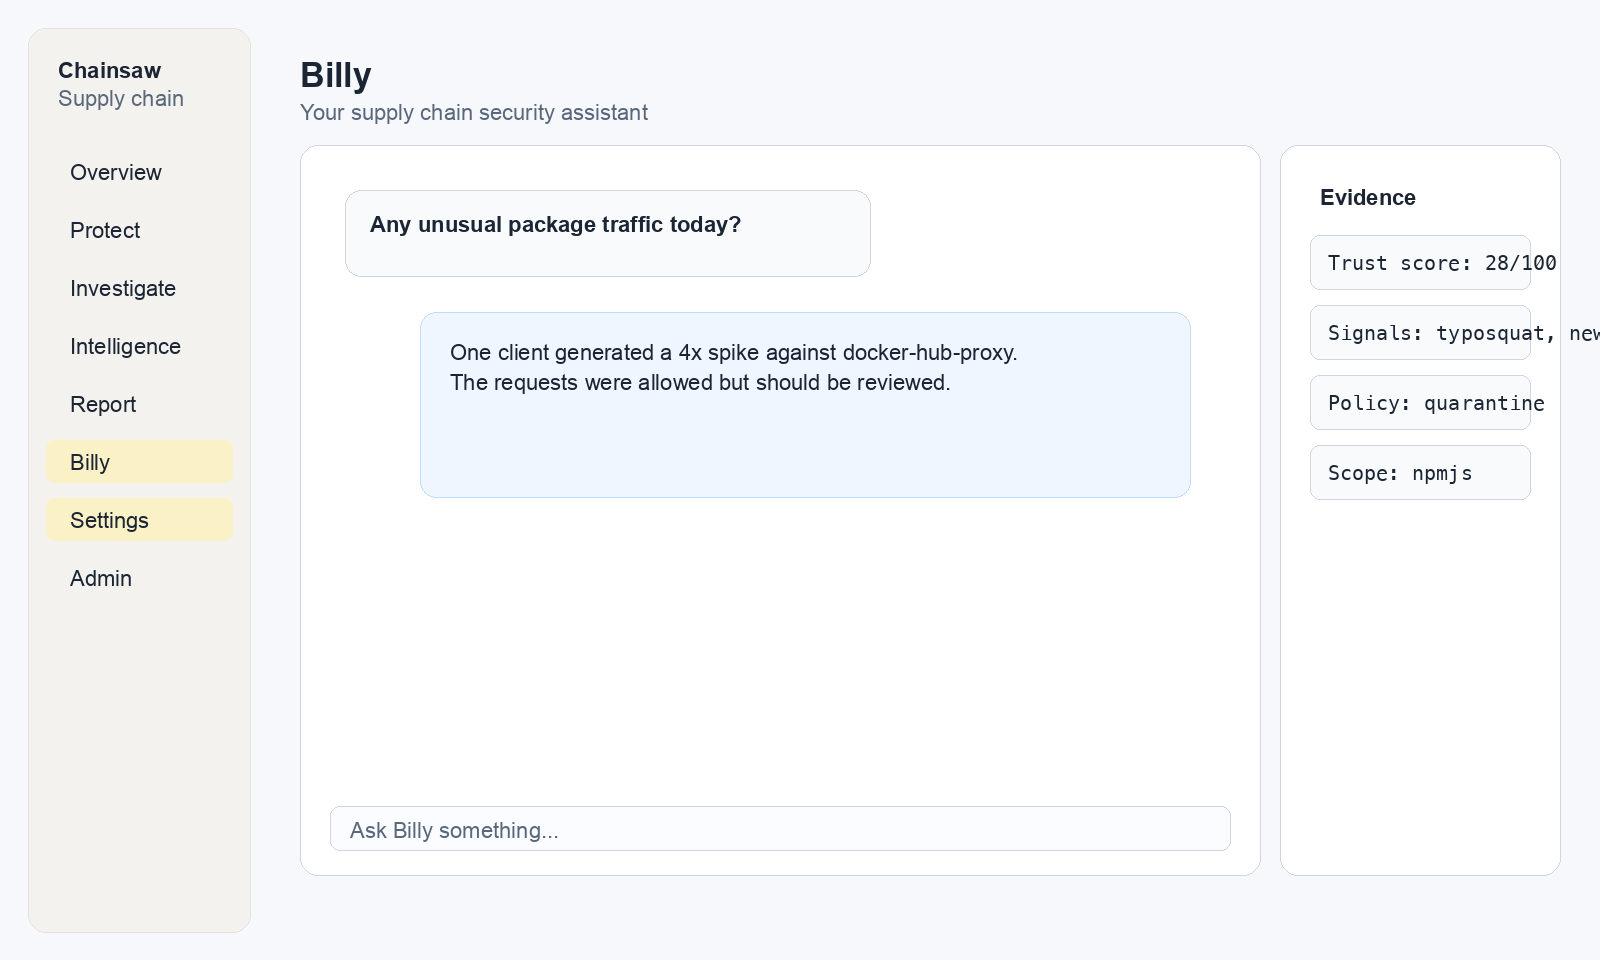
Step 7: Use Billy for Traffic Analysis
Ask Billy to help analyze traffic patterns:
"What are the top 10 most downloaded packages this week?"
"Show me all failed requests in the last 24 hours"
"Which client has the highest request volume today?"
"Are there any packages being requested that we haven't seen before?"
Step 8: Set Up Monitoring Workflows
Daily Check
- Open Traffic page
- Filter by outcome =
blockedorflagged - Review any new violations
- Check for anomalous patterns
Weekly Review
- Compare traffic volume to previous week
- Review top packages by request count
- Check cache hit ratio trends
- Identify new packages entering the supply chain
Incident Response
- Filter by the suspected time window
- Isolate the affected client or package
- Trace the request chain
- Cross-reference with audit logs
Next Steps
- How to Use the Dashboard to Track Supply Chain Health KPIs — High-level metrics and trends
- How to Use Audit Logs to Track Consumption — Complementary audit trail
- How to Monitor Violations and Respond to Blocked Packages — Deep dive into violation handling